I worked on NOAA's Loran Conversion Tool: take old Loran time differences from fisheries data and spit out latitude and longitude. That meant relearning how a LORAN chain is published, how a receiver is told which chain to listen to, and how measured TDs plus known tower coordinates turn into a fix.
This post is the technical path: published chain tables, the equations, then an interactive demo whose numbers plug straight into those equations.
What you are solving for
You do not need absolute time. You need two time differences and a book of station data.
A LORAN chain is a Master plus Slave transmitters on surveyed baselines. The Master fires first. Each Slave waits a known emission delay, then fires. Your receiver measures the time difference (TD) between hearing the Master and hearing each Slave. Same family of math as multilateration / TDOA.
Master
Reference transmitter. Everything is timed off its pulse.
Slave X / Y
Partner stations. Each has a published coding delay and fixed coordinates.
GRI
Group Repetition Interval. The chain ID you dial into the receiver so it locks the right pulse group.
Coding delay (CD)
Extra wait after the baseline travel time, so the receiver can tell which Slave answered.
Emission delay (ED)
Baseline travel time / c plus coding delay. Published (effectively) once you know the tower positions and CD.
The chain is in the book
Before you measure anything, you pick a chain and load the published tower data.
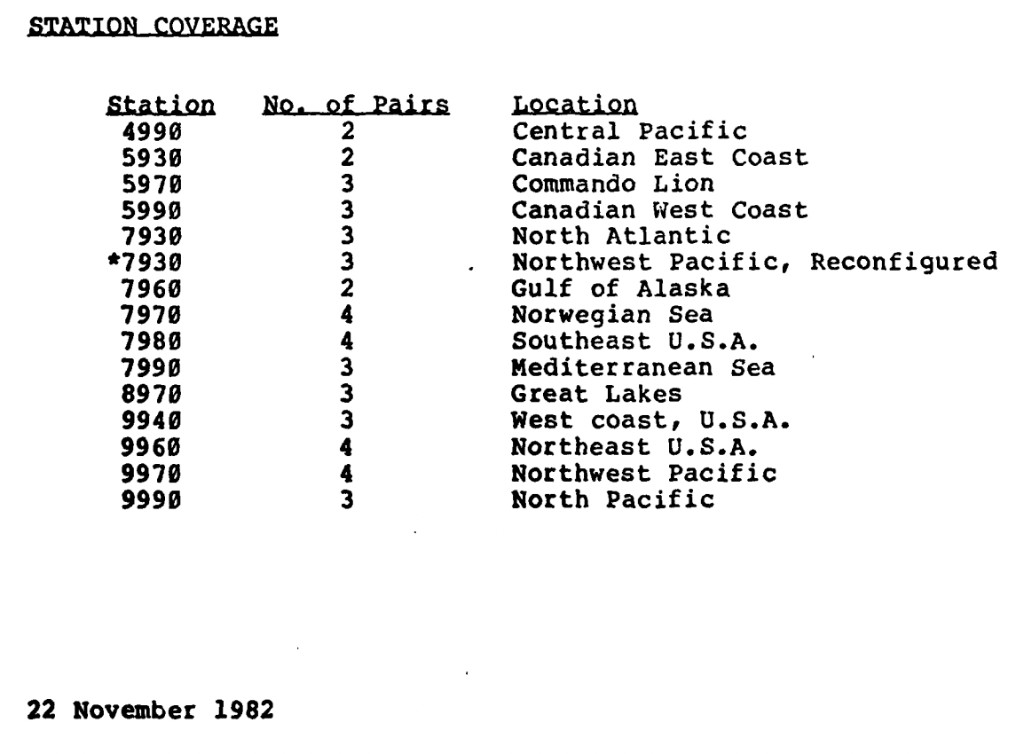
LORAN was not "scan the sky and invent a constellation." Chains were named, numbered, and printed. A navigator (or a fisheries dataset, or a conversion tool) had to know which chain to listen for. That choice is the GRI: a four-digit station number such as 9960 (Northeast U.S.A.) or 7980 (Southeast U.S.A.). The receiver is set to that interval so it syncs to the right Master/Slave pulse group.
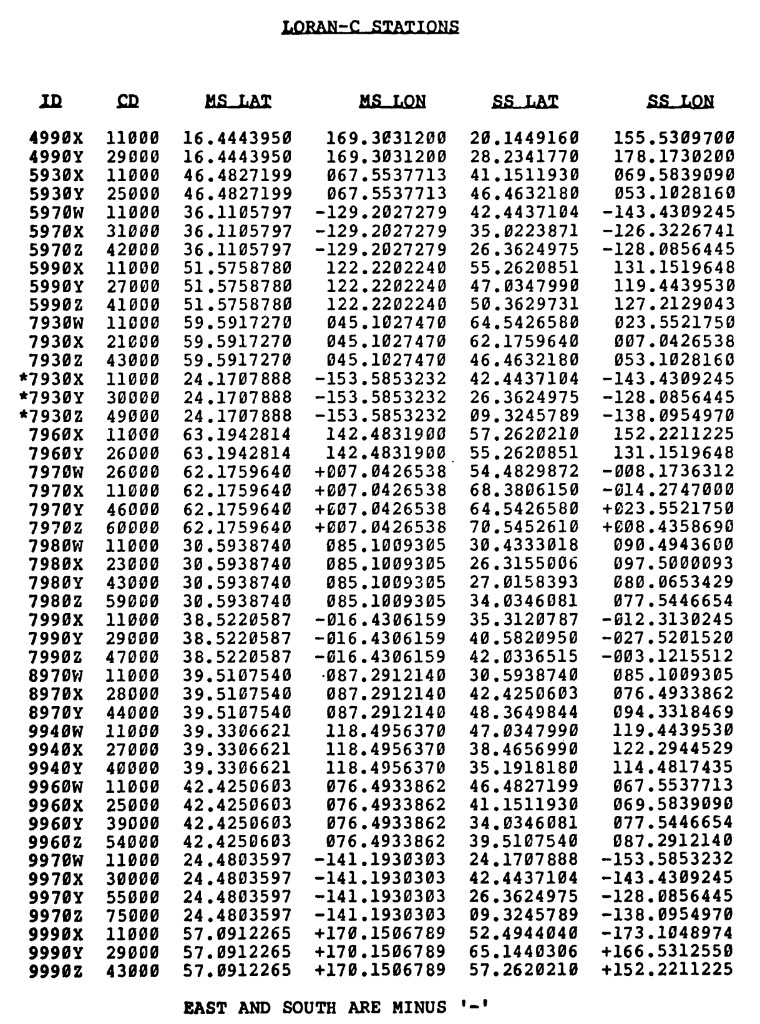
Once you know the chain, you still need the towers themselves: Master lat/lon, each Slave lat/lon, and each Slave's coding delay. That is what navigators used when setting up the calculation. The receiver measures TDs. The book supplies the geometry those TDs are relative to.
Real LORAN-C also used an effective groundwave propagation speed (close to, but not exactly, c). The demo below slows light way down and works in a flat 2D map, but the algebra is the same shape as the book problem.
Equations for a fix
Measure two TDs. Subtract known emission delays. Convert to path differences. Intersect two hyperbolas.
For one Master-Slave pair, the receiver observes:
TD = tSlave - tMaster
Time from Master arrival to Slave arrival at your antenna.
The Slave did not fire at the same instant as the Master. It waited the emission delay ED (baseline travel time plus coding delay). Strip that out and multiply by propagation speed to recover the path-length difference:
Δ = c · (TD - ED)
ED = (baseline / c) + coding_delay
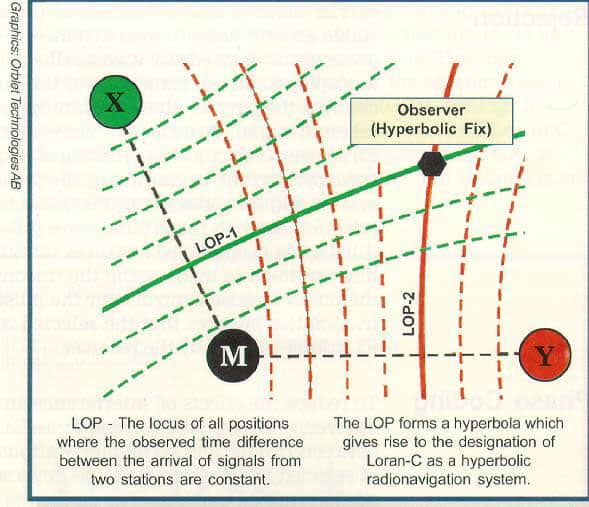
Δ is distance to Slave minus distance to Master. Every point with the same Δ lies on one hyperbola with foci at the two towers.
Do that for Slave X and Slave Y. You get ΔX and ΔY, two hyperbolic LOPs, and their intersection is the fix. In software (or on a chart), you solve for the point P where:
|P - SlaveX| - |P - Master| = ΔX
|P - SlaveY| - |P - Master| = ΔY
Demo: watch the numbers
Scaled light speed c = 80. Coding delays X = 1.4s, Y = 2.6s. Drag the receiver and the TDs change.
Hit Play. The HUD shows TD(X), TD(Y), emission delays, and c·(TD-ED) for each pair. Those path Δ values are the hyperbola constants. Where the two curves meet is the fix.
At the demo's default receiver position, the readout lands on numbers like this (rounded the same way the HUD does):
EDX ≈ 7.79s TDX ≈ 8.26s
EDY ≈ 9.8s TDY ≈ 11.34s
ΔX = c·(TDX - EDX) ≈ 38 map-units
ΔY = c·(TDY - EDY) ≈ 123 map-units
Plug those Δ values into the two hyperbola equations with the demo's Master and Slave positions. The unique crossing in the coverage area is the receiver. Move the receiver, rerun Play, and watch TD and Δ update: same algebra, new curves, new fix.
Where this came from
Short context only. The math above is the point.
1940s
LORAN-A
LORAN-A in WWII from MIT's Radiation Lab and Bell Labs, ~1850-1950 kHz. The Coast Guard ran the operational side. Envelope matching, shorter range than what came next.
1950s
Later
Charts, GPS, eLoran
Civilian receivers and charted rates made TD-to-fix routine. GPS replaced day-to-day use; low-frequency LORAN (and eLoran) still shows up as backup talk because the signals are hard to jam. US Loran-C transmissions stopped 8 February 2010.